Backtest Tracking error

Assessing our operational performance

18 Sep 2021

As we have noted in the past, we simulate everything we do in a backtesting framework. Recently, we asked ourselves: (1) how does our backtest compare to reality, and (2) how closely do our clients who might be cost-constrained due to smaller balances track this measure.


Key takeaway: Our analysis from a sample of actual live accounts confirms that client accounts closely track the simulation results from our backtesting framework. This is great news! Even more important, the accounts closely tightly track each other, despite the over 25x difference in average balance between the largest and smallest! Lastly, the introduction of fractional trading by our primary brokerage partner halved the tracking error between accounts leading to even higher operational efficiency.


A key tenet of our approach is to take a systematic approach to portfolio management. At the start of our journey, the engineers on the founding team took months to build a custom backtesting framework — i.e. a simulator — that allows us to test various ideas before deploying them in the real world. The multi-year work laid the foundation for how we operate.

Till today, all our [best] ideas are rigorously simulated before being introduced to client accounts. But in this industry, most backtest results usually look super good-looking — only to fall short in reality.

Despite many factors, results from our analysis confirm that our backtest (blue) doesn't just tightly track actual accounts; it falls within tight bands (not above the gray lines). Simply put, our backtest simulator isn't blowing smoke!


Net returns of actual accounts versus backtest

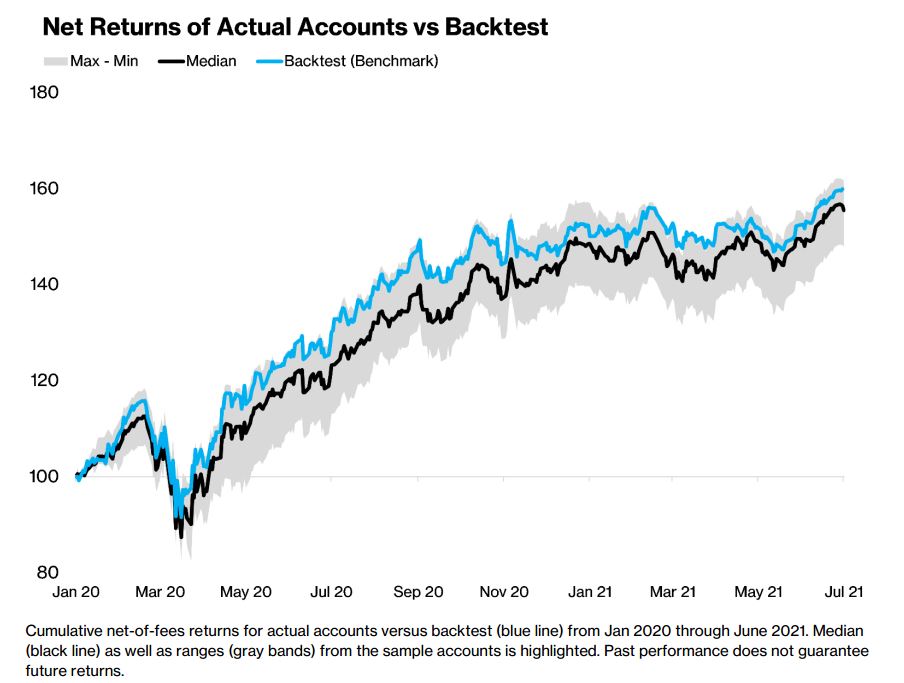
Earlier this year, our primary brokerage partner introduced fractional trading — which allows us to invest as little as $1 in most stocks on behalf of clients, irrespective of its trading price. This further allowed us to put more of your money to work even for accounts with cost constraints. Our findings in early January (see page 7+) suggested that this might be a big win for accounts of all sizes. Today, we confirm that incorporating fractional trading also halved the tracking errors for both small and large: client portfolios with smaller balances are not left out of gains due to cost constraints of us adding nominally expensive stocks to our investable universe.

Both findings reaffirm a high operational efficiency as (1) actual accounts mimic our simulator (2) our separately managed accounts track each other closely even after accounting for factors like differences in account size, execution times, the timing of cash flows, etc. Read the white paper here.

Xantos Labs ("Xantos", "XL") is an SEC-registered investment adviser.

The information contained herein is only as current as of the date indicated and may be superseded by subsequent market events or for other reasons. The views expressed here are those of the authors and not necessarily those of Xantos. Charts and graphs provided herein are for illustrative purposes only. Nothing contained herein constitutes investment, legal, tax, or other advice nor is it to be relied on in making an investment or other decision. There can be no assurance that an investment strategy will be successful. Historic market trends are not reliable indicators of actual future market behavior or future performance of any particular investment which may differ materially and should not be relied upon as such. XL and its affiliates may have positions (long or short) or engage in securities transactions that are not consistent with the information and views expressed in this document.

Diversification does not eliminate the risk of experiencing investment loss. Past performance is not a guarantee of future performance.

The information in this document may contain projections or other forward-looking statements regarding future events, targets, forecasts, or expectations regarding the strategies described herein and is only current as of the date indicated. There is no assurance that such events or targets will be achieved, and they may be significantly different from that shown here. The information in this document, including statements concerning financial market trends, is based on current market conditions, which will fluctuate and may be superseded by subsequent market events or for other reasons.

Hypothetical performance results have many inherent limitations, some of which, but not all, are described herein. The hypothetical performance shown was derived from the retroactive application of a model developed with the benefit of hindsight. Hypothetical performance results are presented for illustrative purposes only.

This material is intended for informational purposes only and should not be construed as legal or tax advice, nor is it intended to replace the advice of a qualified attorney or tax advisor. The factual information set forth herein has been obtained or derived from sources believed by the author and XL to be reliable, but it is not necessarily all-inclusive and is not guaranteed as to its accuracy and is not to be regarded as a representation or warranty, express or implied, as to the information’s accuracy or completeness, nor should the attached information serve as the basis of any investment decision.

Xantos may provide links to third-party websites only as a convenience, and the inclusion of such links does not imply any endorsement, approval, investigation, verification or monitoring by us of any content or information contained within or accessible from the linked sites. If you choose to visit the linked sites, you do so at your own risk, and you will be subject to such sites' terms of use and privacy policies, over which xantoslabs.com has no control. In no event will XL be responsible for any information or content within the linked sites or your use of the linked sites.

Ready to get started?

app_store google_play
xantos-logo Get the app