Markets follow a cycle. We continually assess where we are in the cycle and would like to share insights into how we are positioning the portfolio this year. Let’s start with a recap of classic themes in investor behavior, which usually goes like this:
- Easy access to credit causes investors to relax their attitude toward risks
- This drives economic opportunities and asset prices soar
- Eventually, investors conclude that economic prosperity may go on forever. The excess optimism drives rampant speculation and greed until the bubble pops
- Fear spreads. Excesses in pessimism cause significant declines in asset prices as fearful investors pull money out of risky assets and credit dries up
- Borrowing costs rise and economic activity shrinks
- Investors slowly realize that fear has spread too far and realize things are getting better, slowing expanding access to credit — (the cycle repeats)
We believe we are in the early stages of #5 of the cycle today albeit the credit window is still open.
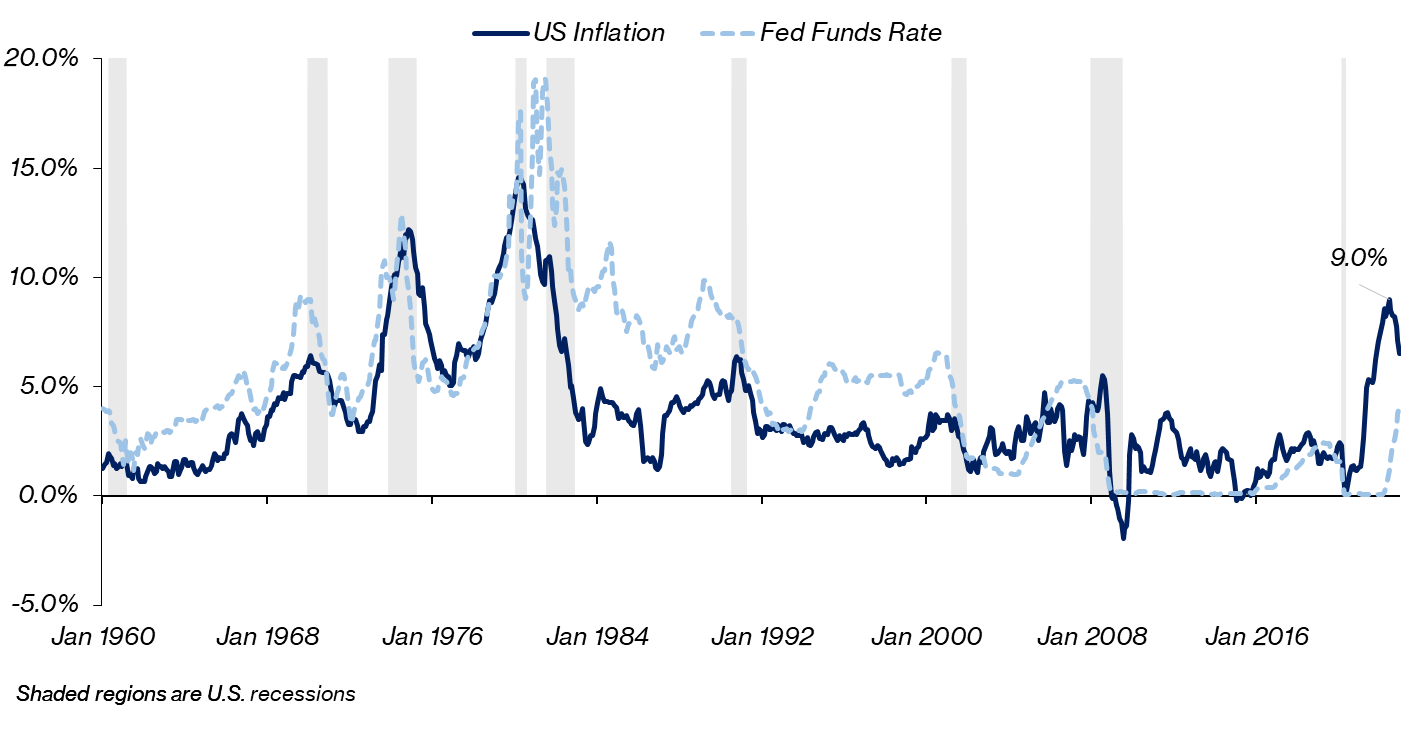
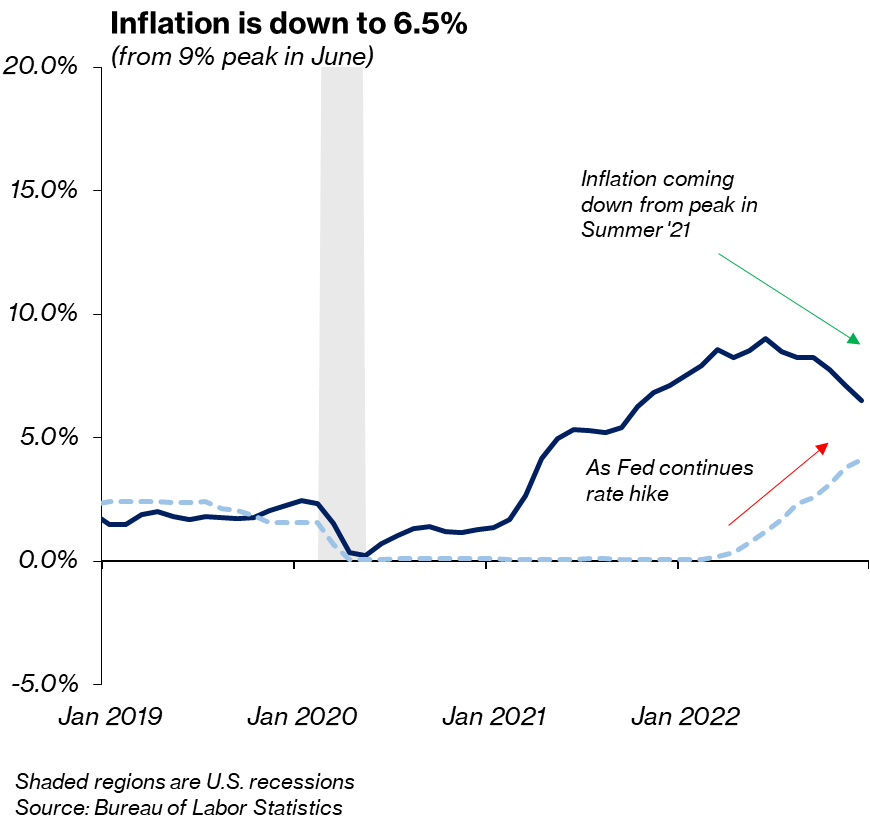
Inflation remains elevated but slowing
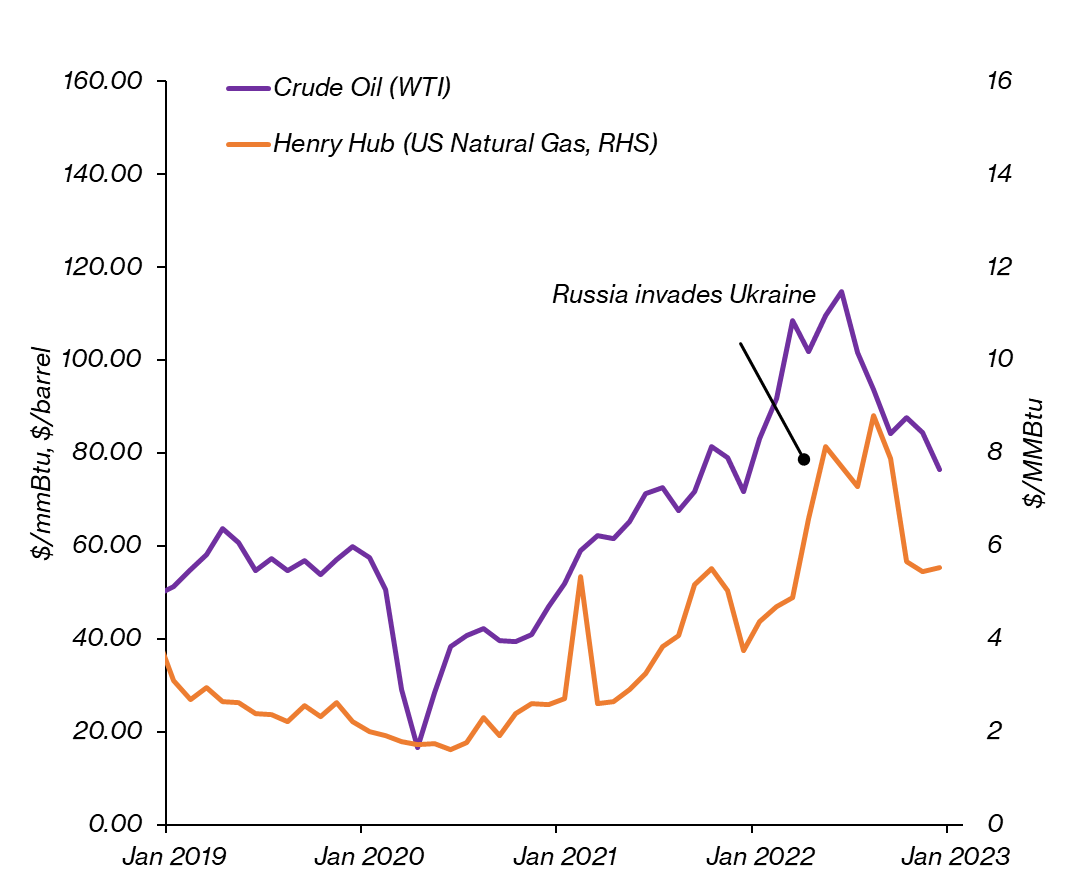
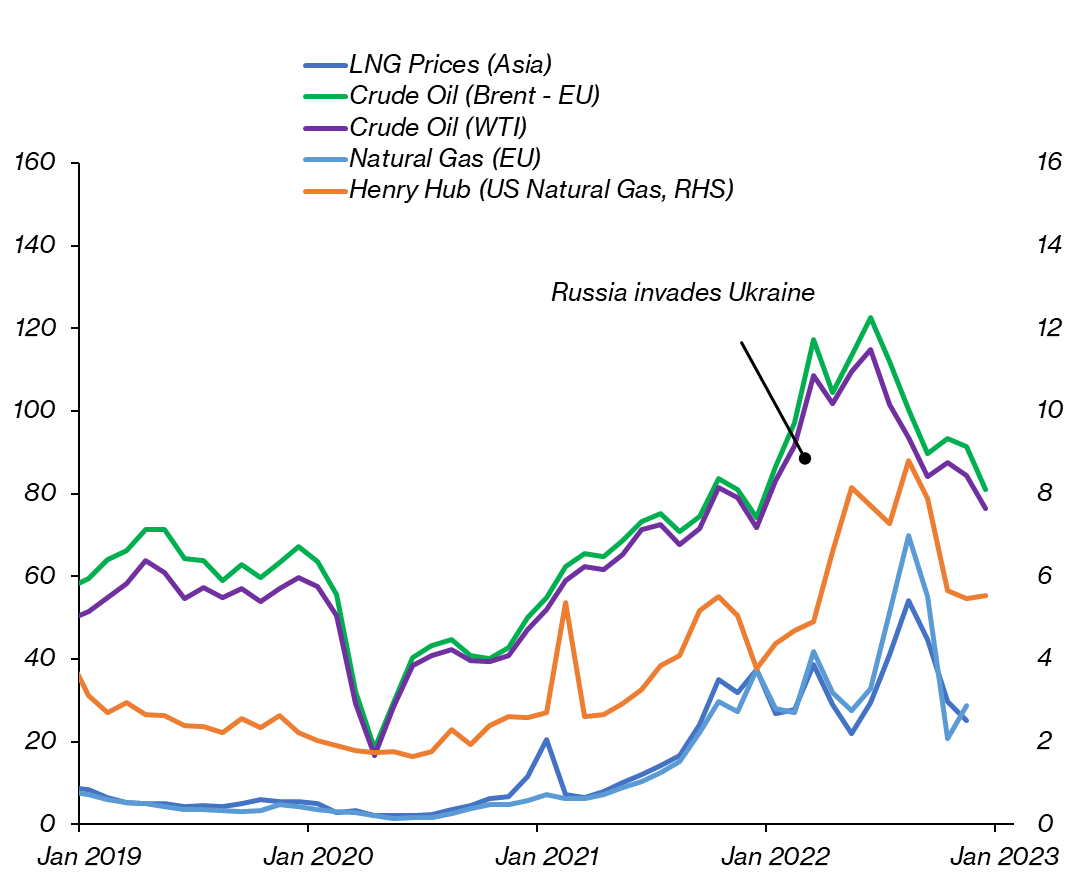
We are far from Fed’s 2% target but the trend shows a slowdown on an annual basis. The recent drivers of headline inflation such as energy and food prices — which rose sharply with Russia’s invasion of Ukraine — have come down from the war-driven surge. Core inflation, which strips out volatile energy and food prices, has also been trending downward to 5.7% in December on an annual basis, from 6% in November.
 |
 |
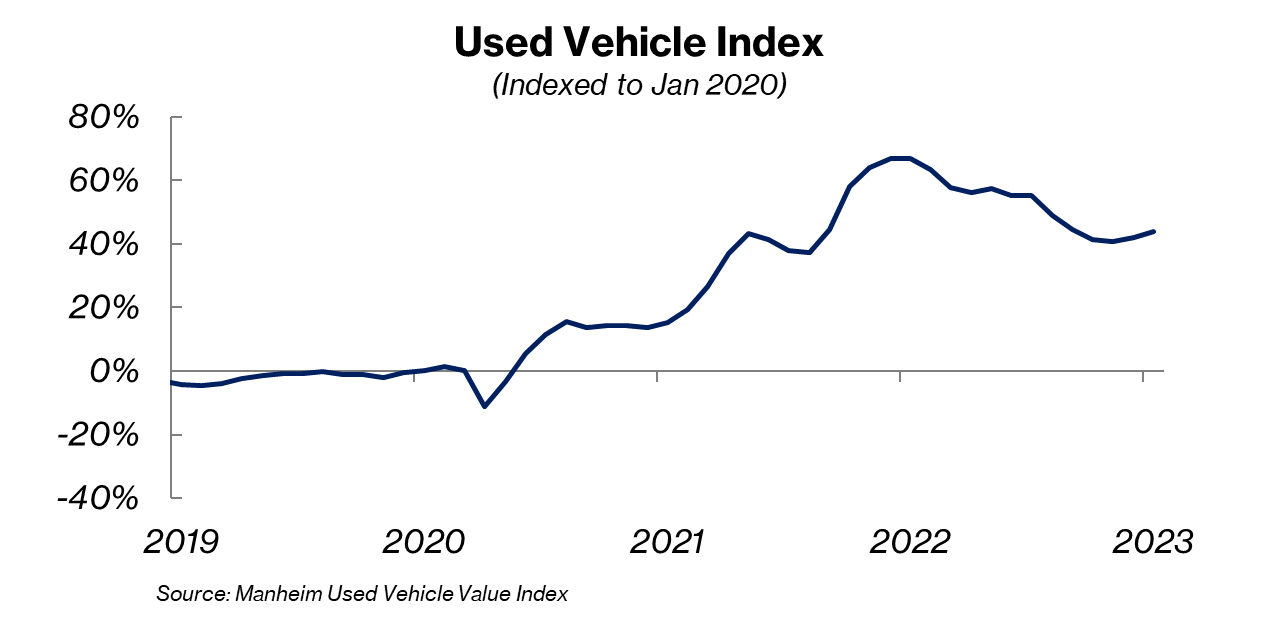
The demand for used cars —coupled with the chip shortage — which drove price inflation in 2021, has slumped from recent peaks although used car prices remain above pre-pandemic levels. The Manheim Used Vehicle Value Index — which tracks prices of used vehicles sold at its U.S. wholesale auctions, fell 14.9% in December 2022 from the year prior, the largest decline in the metric’s history.
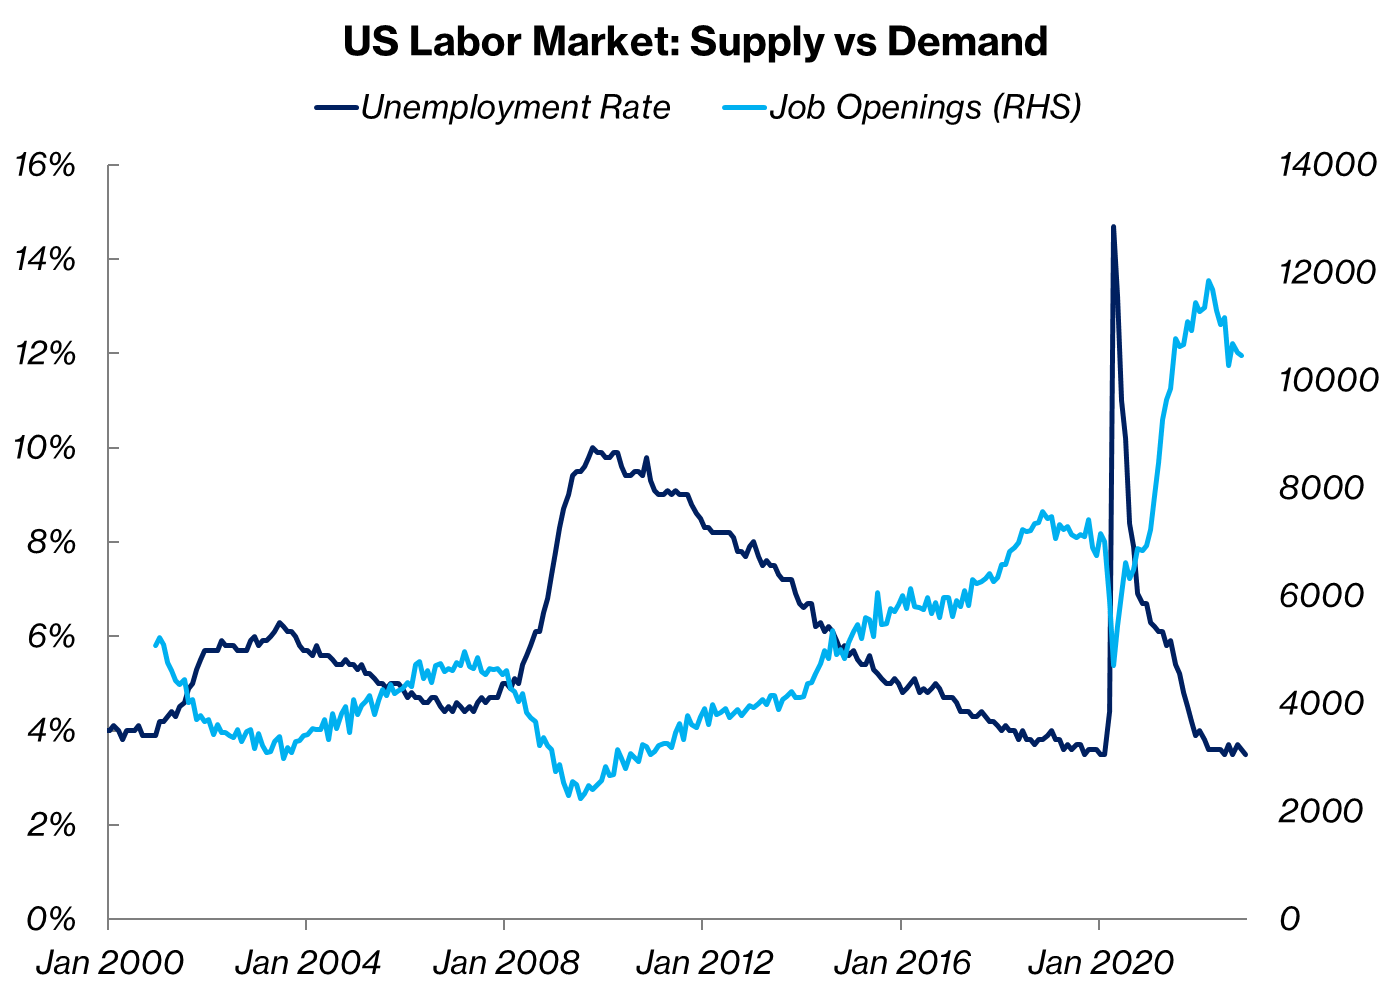
The US labor market remains tight
Despite the increasing news of layoffs and hiring freezes, the US labor market remains tight, giving the Fed breathing room to maintain its aggressive tightening stance. We believe the corrective workforce positioning is coming from sectors that over-hired in hopes of an unsustainable post-pandemic recovery.
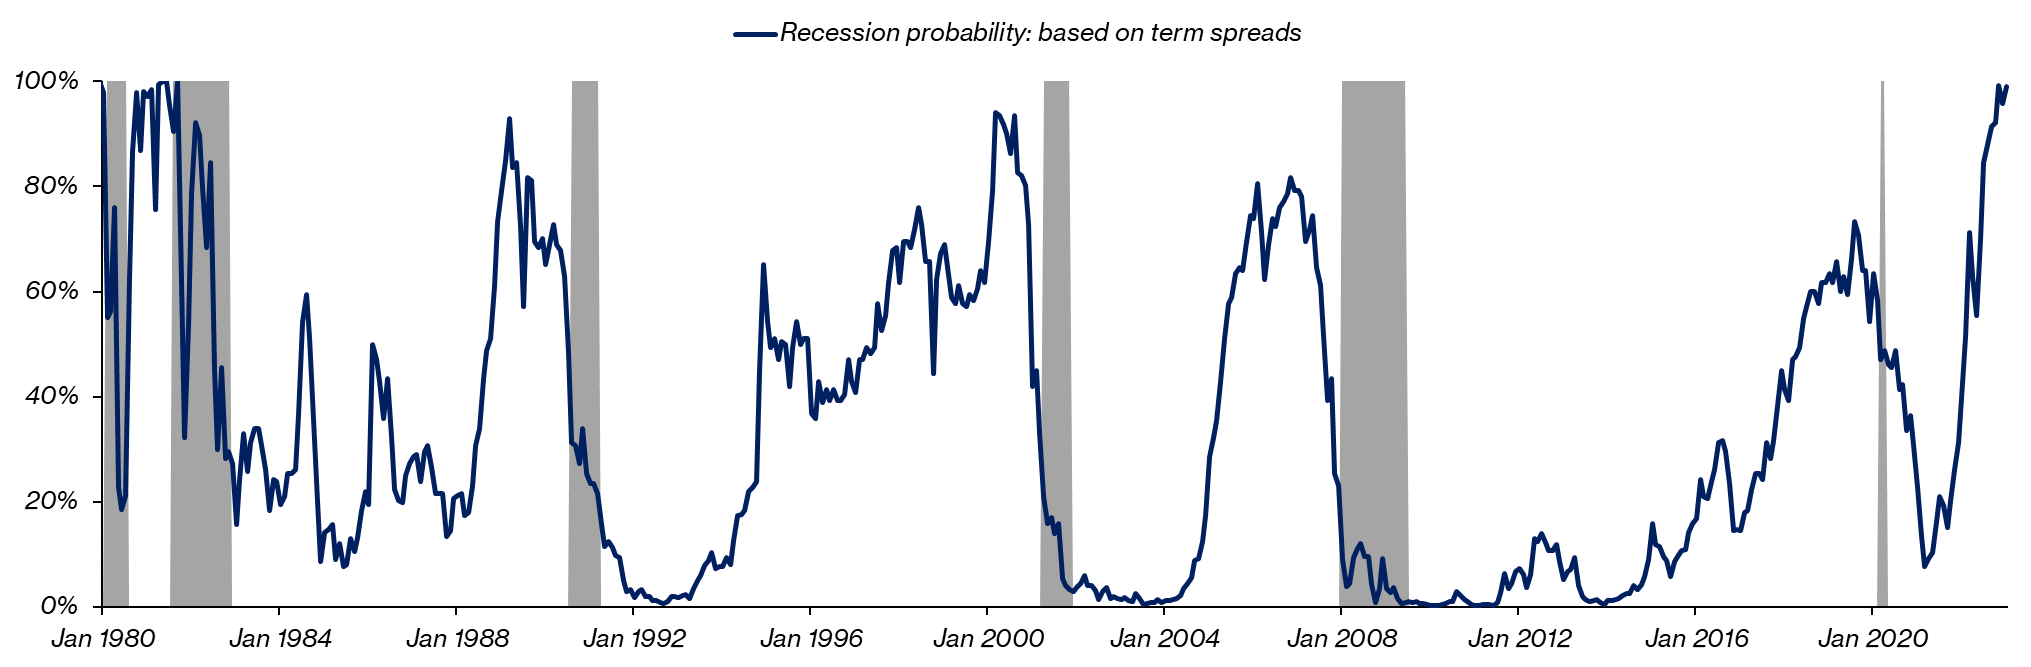
Recession is now very likely
Most economists expect that the Fed's policy actions will result in a recession in the near term. Our just-in-time model shows we are not in a recession at this moment as real GDP growth remained robust at +2.1% for FY2022. Growth is slowing and earnings expectations are now being revised down.
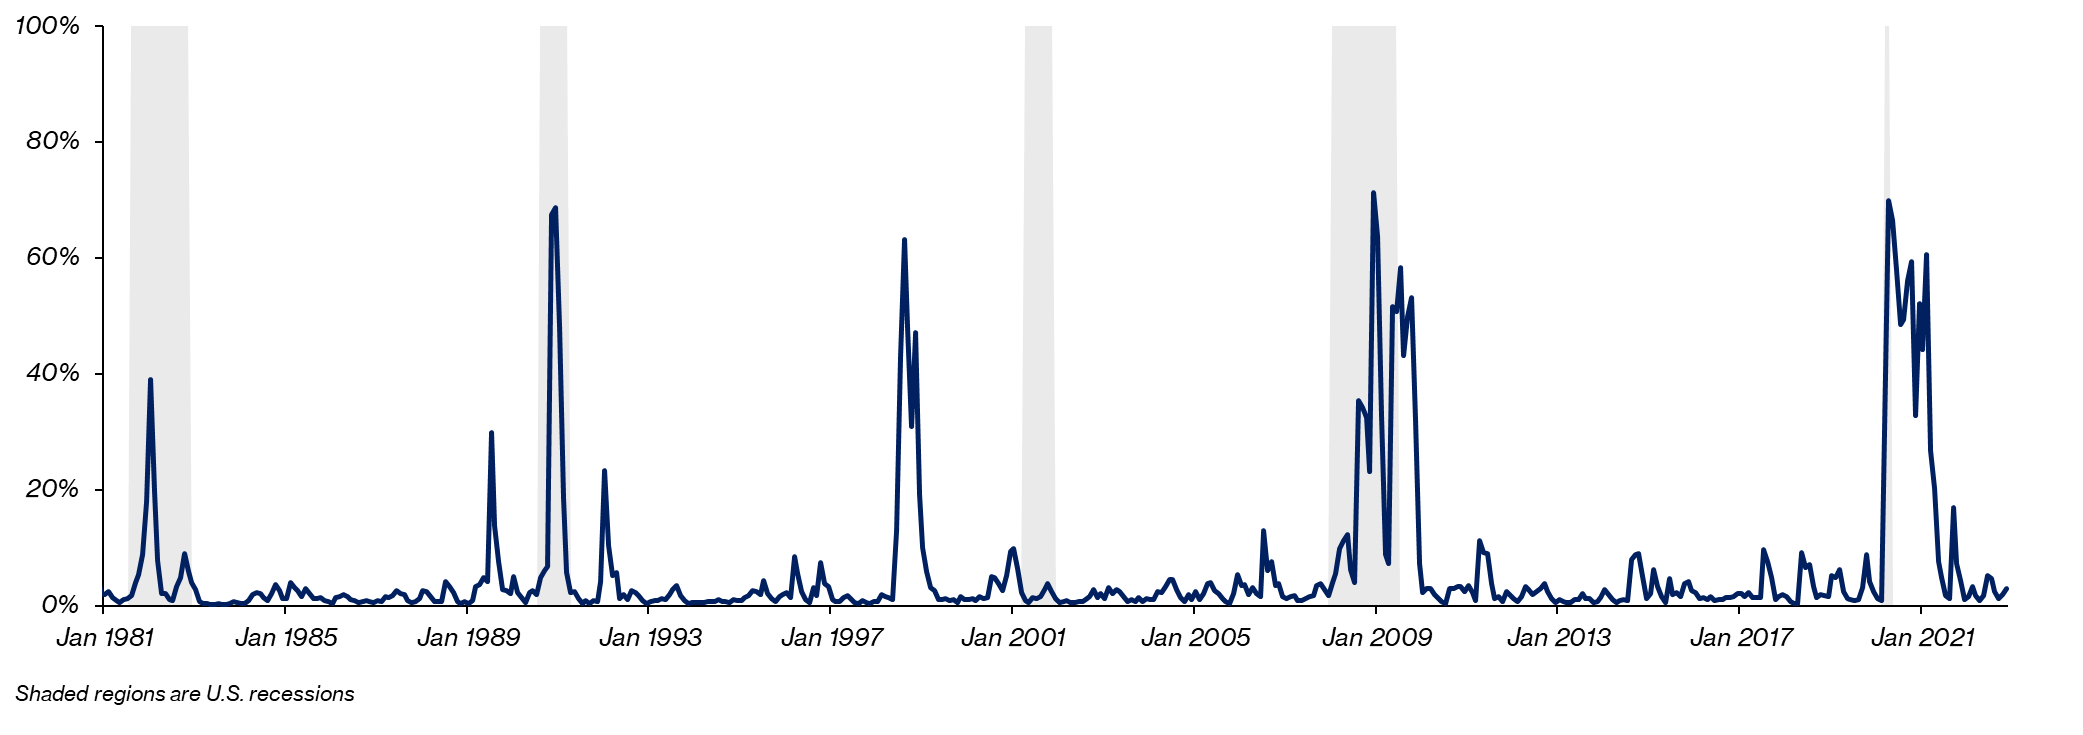
Looking ahead, our model now projects that the likelihood of a US recession in the near term is very very high — at 99%.
It is my belief we are headed for a recession. However, does that warrant reducing our investments or altering our allocation? My answer is no — it is time, not timing that builds wealth. Timing a bottom is a fool's errand. With a long-term focus in mind, we have positioned our portfolio for resilience and relaxed our aggressive bias given the murky outlook. I believe investors are better off ignoring short-term developments and focusing on the long-term. The truth is that most won’t.
As is usually the case, the dislocations in the market in 2022 were asymmetric in nature. The stocks that rose the fastest, fell even harder when conditions changed, following the cycle we’ve seen over and over. In the late 1990s, tech was the talk of the decade as investors with a lax attitude to risk and little research pumped money into companies with unproven business models. From 1990 to 1999, the NASDAQ was up double-digits for 8 out of 10 years. When you saw your neighbor get a new car and a bigger house, it was difficult not to join the herd. The index rose double-digits for five straight years from 1995 to 1999, gaining +40%, +23%, +22%, +40%, and +86% each of those years. Eventually, the bubble popped in the dot-com crash of the early 2000s, and those overvalued tech stocks dropped like a knife. NASDAQ fell -39%, -21%, and -31% for the next consecutive years. In the 2008 Global Financial Crisis, the financial sector was hardest hit losing 55% and in 2022, it was Facebook, Netflix, Coinbase, Rivian, cryptos, and SPACs. Again asymmetric dislocations come from classic swings in investor psychology. We summarize our overview of the macro picture today below. What happens next is anyone's guess but, with history as our guide, the cycle will repeat itself. We remain cautious and have reduced exposure to growth stocks, focusing on value. We have positioned and remain on the hunt for quality at cheap or fair prices, come what may.
|
Condition today |
Comments (U.S. focused) |
|
|
Unemployment |
Low |
At 3.5%, a half-century low, and monthly non-farm payroll remains above pre-pandemic avg |
|
Job market |
Tight |
Thanks to strong wage growth at 5% y/y, supply imbalance with 10.5M openings (1.67 opens per unemployed), despite spreading tech layoffs |
|
Fed Policy |
Tightening |
Rates today are between 4.25%-4.75%. A 25 bps increase is expected after Jan 31st FOMC meeting |
|
Consumer Credit Window |
Still open |
Despite high borrowing costs with a 30-year mortgage at 6.4% (from 3.7%), elevated auto loan rates |
|
GDP Growth / Consumer Spending |
Robust |
+2.9% real growth for 4Q’22 to $20.2T. Contributors include resilient consumer spending from wage growth and nominal price increases |
|
Recession |
Expected |
The near-term probability remains elevated |
|
Inflation |
High (but slowing) |
December CPI is +6.5% headline y/y and +5.7% for core. |
|
Shipping & Supply chain bottlenecks |
Improving |
Freight costs are down significantly from pandemic-driven peaks but still above pre-pandemic levels due to developments in Asia |
|
Housing Market |
Resilient |
Existing home sales fell for the 11th straight month in Dec to 4.02MM but weekly mortgage applications continue to rise at a slower pace due to borrowing costs |
Sources: U.S. Bureau of Labor Statistics, Federal Reserve, Commerce Department, National Association of Realtors, Mortgage Bankers Association, Supply chain and freight costs from Global Supply Chain Pressure Index by Federal Reserve Bank of New York, On-time rates and delays by Sea Intelligence, Shanghai Containerized Freight Index and Drewry World Container Index