Backtest DCC

Tuning our engines for years ahead

20 Aug 2022

As you may know, we employ a systematic approach when deciding how much money should be invested in each stock we own. We believe this approach helps us ensure a repeatable strategy that puts emotions aside when investing. The process is based on several years of R&D going back as far as 2014. 

We continue to improve our process with a focus on delivering better-than-average risk-adjusted returns over the long term. Our workflow is simple: explore the latest concepts, test them thoroughly in our backtest across different market conditions, and deploy only the best ideas to client portfolios.

Well today, we are excited to share some improvements to our systematic process that are based on the autoregressive conditional heteroskedasticity (ARCH) modeling concept pioneered by Robert Engle for which he was awarded the Nobel Prize in 2003.

The concept is simple: How much stock prices move up and down (i.e. volatility) is time-dependent. Volatility today might be based on stock market performance yesterday. In fact, the data shows that trading days with high volatility tend to be followed by trading days with high volatility; and similarly for days with low volatility. This is called temporal dependence. Our previous models—which focused more on the downside co-movement of stock prices—implicitly ignored this temporal dependence, treating each trading day as independent from the last; and that's not good enough. Accounting for temporal dependence when forecasting volatility can help one better manage risk.

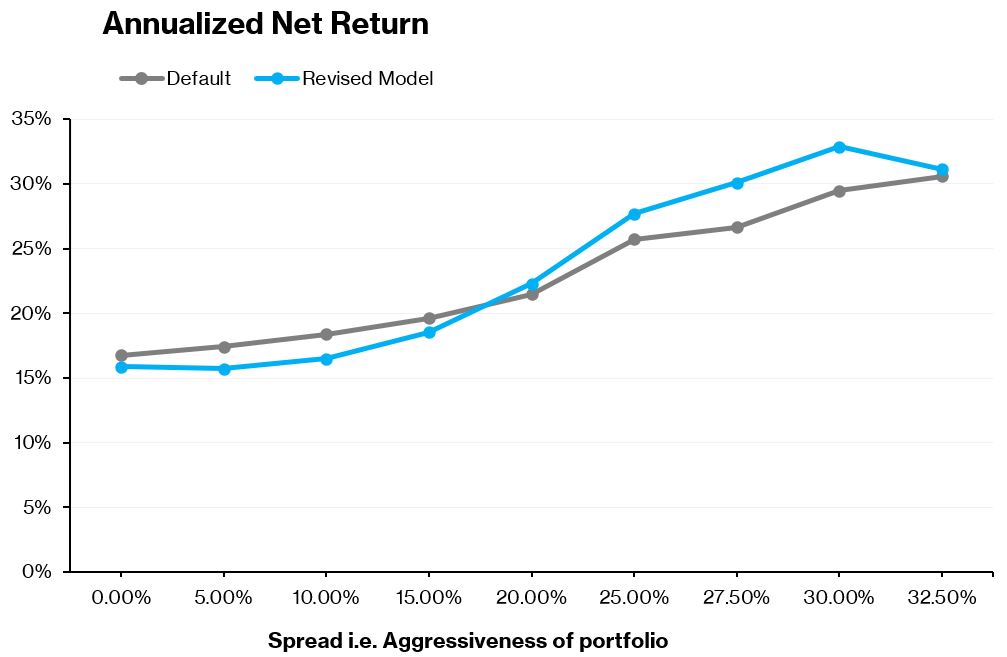
From the get-go, we incorporated a way to specify how much risk we were willing to take on for a given portfolio. We call this knob, spread—a higher spread means more risk or a more aggressive portfolio; a lower spread means ... you get the idea. We explored several models based on Engle's ARCH for levels of aggression and compared those models' performance to our current model, looking back about two decades. 

The result below speaks for itself. For what we consider moderate to aggressive risk tilts (i.e. spread above 20%), the best-performing updated model significantly outperforms our baseline. The peak difference in annualized performance is quite significant, as much as 2% (or 200bps) on an annualized basis. Seasoned investors know that an extra 200bps compounds to almost 1.5x extra gains over two decades. That's a major win, even for backtest results! You can find more details in this white paper.

Also notable is that the additional gains do not come at the cost of higher volatility. In other words, for our target risk tilts—where most of our portfolios typically operate—the risk-adjusted returns are much better with these changes. 

There is a lot more to do here and we are very grateful to Luyang Zhang from UC Santa Barbara for his immense contributions during his 3+ month summer internship with the firm.

Xantos Labs ("Xantos", "XL") is an SEC-registered investment adviser.

The information contained herein is only as current as of the date indicated and may be superseded by subsequent market events or for other reasons. The views expressed here are those of the authors and not necessarily those of Xantos. Charts and graphs provided herein are for illustrative purposes only. Nothing contained herein constitutes investment, legal, tax, or other advice nor is it to be relied on in making an investment or other decision. There can be no assurance that an investment strategy will be successful. Historic market trends are not reliable indicators of actual future market behavior or future performance of any particular investment which may differ materially and should not be relied upon as such. XL and its affiliates may have positions (long or short) or engage in securities transactions that are not consistent with the information and views expressed in this document.

Diversification does not eliminate the risk of experiencing investment loss. Past performance is not a guarantee of future performance.

The information in this document may contain projections or other forward-looking statements regarding future events, targets, forecasts, or expectations regarding the strategies described herein and is only current as of the date indicated. There is no assurance that such events or targets will be achieved, and they may be significantly different from that shown here. The information in this document, including statements concerning financial market trends, is based on current market conditions, which will fluctuate and may be superseded by subsequent market events or for other reasons.

Hypothetical performance results have many inherent limitations, some of which, but not all, are described herein. The hypothetical performance shown was derived from the retroactive application of a model developed with the benefit of hindsight. Hypothetical performance results are presented for illustrative purposes only.

This material is intended for informational purposes only and should not be construed as legal or tax advice, nor is it intended to replace the advice of a qualified attorney or tax advisor. The factual information set forth herein has been obtained or derived from sources believed by the author and XL to be reliable, but it is not necessarily all-inclusive and is not guaranteed as to its accuracy and is not to be regarded as a representation or warranty, express or implied, as to the information’s accuracy or completeness, nor should the attached information serve as the basis of any investment decision.

Xantos may provide links to third-party websites only as a convenience, and the inclusion of such links does not imply any endorsement, approval, investigation, verification or monitoring by us of any content or information contained within or accessible from the linked sites. If you choose to visit the linked sites, you do so at your own risk, and you will be subject to such sites' terms of use and privacy policies, over which xantoslabs.com has no control. In no event will XL be responsible for any information or content within the linked sites or your use of the linked sites.

Ready to get started?

app_store google_play
xantos-logo Get the app